Geographic Information Systems |
What is a Geographic Information System (GIS)?
- A database of geographic or spatial data (data related to position) integrated with other data sets
- Software tools to manipulate that spatial data (search, sort, visualise, analyse, combine)
- Related tools and systems, e.g. GPS, satellites, remote sensing

GIS allows users to view, understand,question, interpret, and visualize data in many ways that reveal relationships, patterns, and trends in the form of maps, globes, reports, and charts. A GIS helps users answer questions and solve problems by looking at data in a way that is quickly understood and easily shared - LEENA KANICKARAJ, https://www.arcweb.com
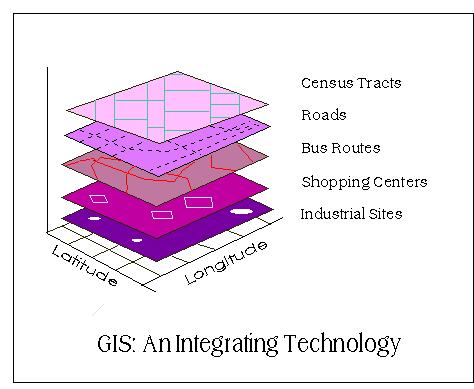
In a GIS, database information (attribute data) is linked to spatial data (feature layers) – e.g. for schools...
- School location = spatial data.
- School name, type, size etc = attribute data.
Combining the two data types makes GIS a problem-solving tool.
By merging and querying the different layers of the data database, the GIS lets users perform "why" and "what if" scenarios and create a new map showing a visual analysis.
|
What does a GIS need?
- Data input
- Data storage, retrieval, and query
- Data transformation, analysis, and modeling, including spatial statistics
- Data reporting, such as maps, reports, and plans
Where does GIS data come from... ?
- maps,
- aerial photos,
- satellites,
- surveys,
- censuses,
- underwater sensors,
- GPS data embedded in digital photos,
- user-supplied data e.g. delivery addresses,
- radio collars or tags put on wild animals etc
Data from remote sensing (identifying, observing, measuring an object without coming into direct contact with it)
- aerial photography,
- spacecraft (e.g. Skylab, ISS), space probes
- satellites,
- spy planes,
- drones,
- weather balloons, unmanned weather stations
- web cams,
- tap on/tap off data from public transport
- surveillance cameras

|
Who uses GIS?
- Map makers, GPS systems, military drones, self-driving cars
- Insurance companies – want to know where floods, bushfires, avalanches, car accidents etc will be most likely, and set premiums accordingly
- Companies planning to set up new shops – where are likely customers living?
- e.g. they can estimate a suburb’s wealth by automated counting of swimming pools from satellite photos, or mapping luxury car sales to particular suburbs
- Governments, to record precise land ownership boundaries
- Local councils, to charge rates based on property sizes
- Mining companies, to locate resources
- Epidemiologists tracking pandemic spread
- McDonalds seeking site for new stores
- Road, railway developers
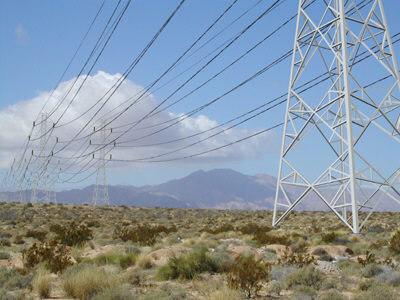
- High tension electricity power line planners
- Sewage system & water supply planners
- to find cheap routes for freeways, rail lines, electricity towers, pipes that avoid populated areas or steep gradients
Google maps and their advertisers
- Government planning bodies – where are populations growing or declining that affect the need for resources (schools, hospitals, police, libraries etc), roads, public transport?
- Wildlife preservation – monitoring loss or gain of suitable habitat for animals/plants
- Telecommunications – where should cell phone / TV repeater towers be put based on distances, elevations, population densities?
- Many many others
|
What can GIS offer
- Combining / comparing different data sets
- Relating different data sets, e.g. geographic features can be combined with political/social data, or a company’s own data
- e.g. We sell diamonds. Some our customers may be worried about “blood diamonds” (look it up). Can we compare our customers’ residential data with the electoral boundaries to see whether we should donate to conservative or liberal political candidates in those electorates who will support diamond sales?
An effective GIS will assist the creation of information to provide the evidence and deliver it to decision-makers [your bosses] in an easy-to-understand format.
GIS information helps you source, collate and enhance various different data sets, and present them in a manner that provides insight and clarity to tell compelling stories and support your mission.
For example, Crash stats is a dataset published by VicRoads which contains information about reported accidents across Victoria.
Each incident record contains detailed information about the incident such as:
- Accident date/time, location
- Severity,
- victim age and sex,
- injuries or deaths,
- vehicle type, make and manufacture,
- cause of accident,
- road surface, weather and lighting conditions
Relating different data sets, e.g. geographic features can be combined with political/social data, or a company’s own data
- e.g. Local council could use its dog registration data to map on local geography suitable for dog walking (green areas, beaches, rivers etc) to see where to put dog poo signs, rubbish bins and doggy poo bags.

One GIS provider advertises...

|
Typical commercial GIS advertising
(We) deliver the power of location data in your hand.
Our reliable, affordable, accessible, high-quality location data covers Australia's 7.6 million km2.
It powers new technologies, products and processes that help improve productivity and stimulate growth.
- fuel better business decisions,
- increase efficiency,
- improve communications or
- unlock new revenue streams
- our GIS data lets you map & analyse data to understand patterns, correlations and geographic context to improve business outcomes.
- our data describes the addresses, land, buildings and transport networks across Australia.
We continuously source, process and deliver data, including APIs and a self-service portal
Our data includes:
- building outlines for all (15 million+) Australian buildings with a roof area at least 9m2
- You can also select attributes for the buildings, including; Heights, Addresses, Pools, Solar panelling and building footprints.
- Planning data - we provide the Planning attribute for each property
- It includes information such as Zone Type and Zone Descriptions.

Our APIs (Application Program Interfaces) provide:
- - Essential location APIs for property developers.
- - Our APIs make it easy to spatially enable your applications through address validation and linkage to one of a kind building data.
Our APIs
- Overcome your data sourcing challenges for a multitude of applications including modelling,
- 3D visualisations and analysis of the built environment.
- Avoid manual work, lead times, inconsistent formats and gaps in coverage with Australia-wide, ready-to-use buildings data.
- help people transform data into actionable insights. Explore with limitless visual analytics.
- Build dashboards and perform ad hoc analyses in just a few clicks.
- Share your work with anyone and make an impact on your business.
- From global enterprises to early-stage startups and small businesses, people everywhere use (us) to see and understand their data.
- Perform detailed analysis using demographic data and built-in mapping capabilities
- Present enormous countrywide datasets clearly and allow drill-down to local areas
- Analyze geographical buying behavior based on product types
- Identify and mitigate risk and efficiencies across geographies
- Analyze revenue and profit by region

A happy customer said:
- We use the mapping feature in (GIS PROVIDER) a lot because, as a cable company, our regional differences are very important.
- Using traditional tools like Excel, it's difficult to get a sense of what the geographic data means without actually seeing it.
- When you see the data on the map, you can actually see what it means and what the different regions are

Above - data layers (satellite, terrain, traffic etc) show different data of interest to different users
|
Some interesting GIS videos
- satellite imagery and remote access (Length 2:34) (Dated 2019)
- Spatial analysis with Arc GIS (2:20) (2018)
- Intro to GIS: Geo Info Systems Fundamentals (2:46) (2014)
- How one NASA image tells dozens of stories (5:42) (2019)
- How To Do Aerial Archaeology From Your Home (6:34) (2020)
- Intro to GIS and Science (9:59) (2012)
Let me know of other good, short GIS videos.
Places for further research and datasets
- http://services.ga.gov.au – Aust govt geoscience data services
- https://data.gov.au/ - govt data sets online
- https://www.gislounge.com/ - GIS data introduction
- https://www.geoscience.gov.au/web-services
- https://esriaustralia.com.au – a sample GIS software supplier
- Please tell me if any of the above links die
|
A final thought...
GIS seems to be the elephant in the ICT room.
It includes nearly all computer/communication/scientific/social areas of study and expertise.
It is BIG BUSINESS, and is growing.
And people are passionate about it.
You might want to consider it as a career path, regardless of your skill set.

|