
![]()
Data Acquisition,
Data Collection Techniques
This webpage replaces the data collection techniques slideshow
Techniques for collecting data to determine needs and requirements, including
- interviews,
- observation,
- reports and
- surveys
Also, I add questionnaires.
Data acquisition
Primary and secondary data can be acquired using observation, interviews, querying of resources, surveys and questionnaires.
Types of questions
An open (or open-ended) question - often used in interviews - is one that does not limit the length, type or content of the answer. e.g. “What would you like for lunch?” Open questions are often better for opinion-based questions.
A closed question - typically found in surveys and questionnaires - forces answers to take a particular form, or allows only pre-determined responses. e.g. “Would you prefer Chinese or Mexican for lunch?” Closed questions are good for collecting facts and numbers.
Closed questions
Offering a limited choice of responses can make it quicker and easier for respondents to answer questions, but they usually cannot give reasons or explanations.
Collating and analysing closed answers is much easier than the longer, unstructured, vague, repetitious or ambiguous answers to open questions. Closed questions are especially suitable for online surveys and questionnaires.
Closed questions may take the form of:
- yes or no answers using radio buttons
- multiple-choice answers, e.g. Preferred public transport: Train / Bus / Tram
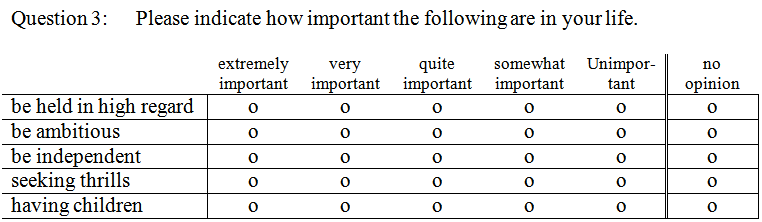
- Likert scales collect data that can be expressed as an attitude on a sliding graded scale.
- Ranked priorities to indicate preferences. e.g. “Place numbers 1 to 10 to indicate which forms of transport you prefer, from most favourite to least favourite.”
Databases allow data fields to be made compulsory, so a record won’t be accepted while those fields are left empty. Only make fields compulsory if further processing would make no sense if the data were missing, e.g. a missing email address when signing up to a mailing list.
If none of the available responses applies, respondents are forced to give inaccurate answers. e.g. “Do you attend church – Frequently | Sometimes | Rarely”. Without a “Never” option, the question builds bias into any information derived from the answers.
The value of closed questions can be enriched by providing optional comment boxes to allow respondents to give further explanation or details.
Formulating good closed questions assumes that you already know all of the applicable options for answers. Open questions are good for preliminary research to gain knowledge about a topic you currently know little about. e.g. if you want to learn about classical music, you would look silly asking a classical pianist a closed question like, “Who was the all-time best musician – Mozart or Britney Spears?”
Once the subject is better understood by using open questions, higher-quality closed questions can be formulated.
Closed questions rely on researchers already knowing what the relevant answers are. If they don't offer an answer as an option, respondents cannot choose that answer and the results will be faulty.
Open-ended questions
Open questions do not impose restrictions on answers. Respondents may give lengthy answers with explanations, examples, qualifications (e.g. “But this only applies if…”), personal opinions, and details; they can even critique the question itself. Answers will be individual, and usually more rich, detailed, and accurate than answers to closed questions.
Open-ended questions become less valuable as the number of respondents increases. Interpreting hundreds of detailed free-form responses is very time consuming and takes a lot of judgement and processing effort to convert them into a form that can be processed statistically. Thus, researchers use coding to convert answers to open questions into a more manageable codes that can be statistically processed.
How would you concisely store this answer: “Well, sort of, a little bit - you know? It depends. Yeah, no. OK. hehehe. Hmmm...”. A closed question offering only Yes/No answers would have forced the respondent to commit to a definite answer that was easy to count and average, but the vagueness, delay and depth of thought shown in the original answer would be lost – and that in itself might have been very informative to the researchers.
To summarise open/closed questions:
Open-ended |
EVALUATION |
Closed |
| Low | Reliability of data | High |
| Low | Efficient use of time | High |
| Low | Data precision | High |
| A lot | Breadth and depth of info gained | Little |
| A lot | Level of skill needed by Interviewer |
Little |
| Difficult | Ease of data analysis | Easy |
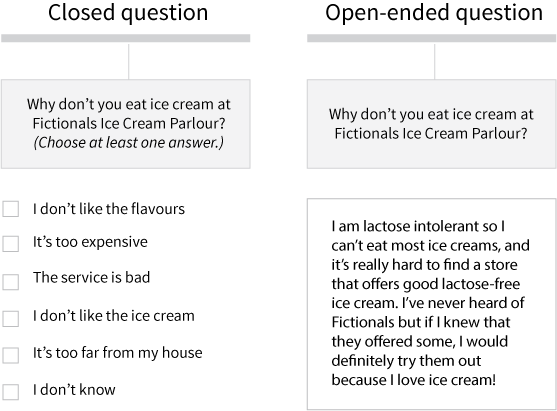 |
Note how this open-ended question allowed an answer that the restrictive closed question did not. A closed question would have required hundreds of options to have gathered the same quality of information that the open-ended question provided. Acquiring this knowledge through an earlier interview process may have improved the quality of the closed question in the questionnaire. |
![]() Questionnaires and surveys often rely on previous exploratory research undertaken with interviews using open-ended questioning.
Questionnaires and surveys often rely on previous exploratory research undertaken with interviews using open-ended questioning.
![]() Imagine if ballot papers for a federal election made voters write an essay instead of putting numbers beside the names of candidates. The coding of qualitative data is important decision.
Imagine if ballot papers for a federal election made voters write an essay instead of putting numbers beside the names of candidates. The coding of qualitative data is important decision.
Whether open or closed, questions can suffer from major faults:
A loaded question contains controversial or unjustified assumptions that may serve to support the hidden agenda of a questioner. e.g.
![]() Secret or hidden agenda – an undisclosed or disguised true ambition or ulterior motive.
Secret or hidden agenda – an undisclosed or disguised true ambition or ulterior motive.
- “Why do you think immigrants are involved in so much crime in Australia?” assumes immigrants are involved in a lot of crime.
- “How did you feel when the red car slammed into the blue car?” implies that the red car was not only responsible for the collision, but it was speeding at the time.
- “Governments waste billions of dollars each year. Do you think taxes should be raised to support this?”
A leading question is one that directs respondents’ answers into certain desired directions.
- “Do you think murderers should get life in prison or the death penalty,” directs the respondent away from suggesting any other alternative.
- “Do you think mothers or fathers make better single parents?” assumes that one sex is always better than the other.
Interviews
Interviews are real-time personal interactions between data gatherers and data providers. The strengths of interviews include:
- unlike questionnaires and surveys, interview questioning can be shaped by the answers received. An interesting answer can be pursued to elicit more information.
![]() It is possible to do limited follow-up on closed questions in questionnaires and surveys by using conditional paths. e.g. “If you answered ‘No’ to Question 18, proceed to Question 25.” Questions 19 to 24 would only be asked of respondents who answered “Yes” to question 18.
It is possible to do limited follow-up on closed questions in questionnaires and surveys by using conditional paths. e.g. “If you answered ‘No’ to Question 18, proceed to Question 25.” Questions 19 to 24 would only be asked of respondents who answered “Yes” to question 18.
- the presence of a real-life interviewer can subtly change the attitude of the interviewee. People usually want to be helpful and dislike disappointing interviewers, so they are often more cooperative, honest and less likely to skip questions.
- tone of voice (interest, disinterest, anger, happiness) can be heard
- body language, facial expressions, pauses, hesitancy, energy, lethargy, and other non-verbal communication can be observed.
- oral answers tend to be longer and more detailed than written answers.
- personal interviews are more likely to elicit accurate information on sensitive subjects than are impersonal surveys or questionnaires.
To gain these benefits, interviews are best done face-to-face, but this is time-consuming and expensive.
Second-best is internet video conferencing which offers some of the benefits of face-to-face questioning, but is cheaper and more convenient.
Telephone interviews are the last choice for real-time person-to-person information gathering since all visual cues are lost and the ‘personal touch’ is weaker.
Interview technique
- introduce yourself and make clear the purpose of the interview and the way the information will be used
- start with easy, quick questions to put nervous interviewees at ease.
- if the information may be personal, follow the spirit of the Australian Privacy Principles even if you are not subject to the Privacy Act
- have a list of questions prepared so you don’t forget them
- avoid getting side-tracked by irrelevant discussion unless it’s informative
- give interviewees time to think and talk
- don’t interrupt answers unless it’s obvious that they are irrelevant or repetitive
- gather the data you want to collect, but leave room for the interviewee to volunteer extra information you never thought of asking about. This can be done by including open questions, and finishing the interview by asking if there’s anything else they didn’t get an opportunity to say.
- audio-record interviews for later reference (with the interviewee’s prior permission. Having to write down answers will distract you from listening actively and closely.
DISADVANTAGES of using interviews
- Costly in terms of time, labour
- Data obtained is qualitative (opinion-based) that must be interpreted and encoded to be able to manipulate statistically
- May be subject to bias from the interviewer
- The presence, appearance, age/sex or behaviour of the interviewer may make subjects be less responsive or truthful about sensitive, embarrassing or incriminating issues.
ADVANTAGES of interviews
- Valuable as a starting point for research into poorly-understood subjects.
- Uncover issues and topics that are later used in broader data collection using quantitative techniques (e.g. surveys)
- Significant information from non-verbal signals can be observed, e.g. hesitation, passion, evasiveness, nervousness, anger, happiness, boredom.
- Subjects speak, not write, so answers tend to be longer and more detailed.
- The interviewer’s presence may encourage subjects to be more cooperative. Most people want to be helpful.
- Unlike surveys/questionnaires, questioning is not pre-fixed. The order and content of questions may change dynamically to pursue interesting or unexpected answers.
Surveys and questionnaires
DISADVANTAGES
- Being anonymous, subjects may decide to lie or boast.
- Difficult or sensitive questions may be left unanswered.
- Using data from surveys/questionnaires that have missing answers may introduce bias into stats.
- The reason that the answers were not given to certain questions may in itself be significant and need further investigation.
E.g. if 90% of females answer a certain question, but only 15% of males answer it, something is clearly interesting and important about the issue in that question! - If data collectors select subjects who are passing by (e.g. in shopping centres), an unconscious bias may make the collector tend to select people of a certain age, sex, ethnicity, status or appearance which may bias the data.
E.g. young female data collectors may be nervous to stop large young men to ask for their participation. - If subjects are volunteers it may be harder to to enforce cooperation. It may introduce self-selection bias – the fact that people volunteer to answer questions may mean they have a vested interest in the subject or they are of a certain personality type that makes them want to help other people
- If subjects are not volunteers they may resent being forced to respond, and give misleading answers
ADVANTAGES
- A lot of data can be quickly collected.
- Quantitative data need not be encoded, so it’s quick to process.
- Can be done online
- Can be electronically validated for existence, type and range.
- Can collect data 24/7.
- Can reach respondents in remote places.
- Can deliver data immediately after its collection.
- Can be modified or amended instantly, if necessary.
- Can be done online
![]() Online surveys and questionnaires can be made reactive to inputs by skipping questions that have been made irrelevant by previous answers.
Online surveys and questionnaires can be made reactive to inputs by skipping questions that have been made irrelevant by previous answers.
![]() Paper-based surveys and questionnaires can achieve similar reactiveness with instructions like, ”If you answered 'No' to Q7, skip to Q13".
Paper-based surveys and questionnaires can achieve similar reactiveness with instructions like, ”If you answered 'No' to Q7, skip to Q13".
Interviews vs Surveys & Questionnaires
- Interviews slowly collect small amounts of deep but narrow insights person by person. Interviews can use lots of detailed “Why?" questions. e.g. “Why do you drink alcohol?”
- Surveys and questionnaires quickly collect lots of less personal and more shallow data from a broad range of people. They have lots of “What…” questions. E.g. “What types of alcohol do you drink? How much? How often?” Free-form extended textual answers are rarely used. Most answers are numerical or chosen from pre-made limited lists of options.
- Interviews often ask different questions of different people, so answers can be hard to compile and compare.
Surveys and questionnaires ask the same questions of all respondents, so answers can be easily compiled, averaged, sorted, graphed, compared. - Interviews usually ask open-ended questions. No fixed format, length or type of answer is enforced. Questions usually seek opinions or reasons.
- Surveys and questionnaires ask close-ended (or closed) questions. Answers have a fixed type and length of response (usually from a limited list) making all answers consistent and comparable. Questions often seek factual information.
Observation
Involves watching people behave naturally in their normal environment.
It can reveal facts that questions may never have anticipated.
Observing people behaving naturally is very informative, since people often mistakenly or deliberately misreport their behaviour because of embarrassment, embarrassment, vanity, unawareness, ignorance, self-delusion or fear of punishment.
Observation reveals what really happens, rather than what subjects say happens.
Survey respondents may not deliberately lie, but can misremember, or not realise what they actually do.
It is important that the observer stays in the background and does not intervene or interfere with natural behaviours.
Sometimes subjects are unwilling to provide data voluntarily, especially if the data may lead to unpleasant consequences, so observation is the only option, e.g.
- people say the “right” thing. When trying to reduce infection rates in hospitals, a survey question like “Do you always wash your hands after going to the toilet?” will always elicit 100% “Yes” answers from busy doctors and nurses, but observation of actual behaviour may disclose the truth.
- E.g. teachers are surveyed about whether they treat male and female students fairly.
The survey indicates 100% compliance.
Observation reveals 50% compliance, according to what researchers think of as ‘fair’.
Survey respondents may not deliberately lie, but may interpret “fairness” very differently. - sking office workers to report the number of minutes they waste daily playing games instead of working is going to be less reliable than observing their actual time usage.
Observation may also be needed when impartial interpretation of behaviour is required. If studying a college’s performance, finding whether teachers deal with students in a “fair, friendly and open” manner is a subjective assessment that is best not left to the teachers being judged.
Subjective – based on opinion or personal judgement. e.g. “Is that salesperson friendly?” Compare with
Objective – based on dispassionate logic, fact or measurement. e.g. “How often does that salesperson smile at customers during a transaction?”
Observation is valuable when investigating the interaction between people, including their non-verbal communication.
Subjects cannot be expected to see and report on themselves with 100% clarity and lack of bias, and observers who differ from their subjects may notice things that the subjects are blind to. Mature observers may see immature behaviour in younger subjects; female observers may see sexist behaviour that male subjects are unaware of; observers of a minority religion might notice unintentional or institutional intolerance in subjects of a dominant religion.
Observation by an ‘outsider’ may often yield valuable data to which subjects have become blinded by constant exposure. For example, an observer might notice unpleasant smells, sexist posters on walls, rude treatment of subordinates, or inefficient work practices that everyday workers might not consciously register any more.
Observation may provide privileged access to events and processes that participants never get to see and cannot report on. For example, to evaluate a live theatre, an audience member can only assess what is happening in front of the curtain. An “access all areas” observer’s privileged permissions allow a far greater insight into the entire operation, including backstage and even events in the manager’s office.
Observation may be overt, where subjects know they are being watched, or covert, where they are unaware. Covert observation (e.g. using cameras or ‘undercover spies’) will be more accurate, but may be more difficult or unethical to achieve.
Observation can also be direct, watching behaviours as they occur (e.g. students eating in a cafeteria) or indirect, where the results of the behaviours are observed (e.g. measuring the amount of food that is left uneaten after students finish their meals.)
Observation may also be electronic, through the use of activity logs, key and screen logging software, and equipment that tracks users’ eye movements when using software, watching videos or advertisements, or using other products.
Observation tips:
- don’t let your observation distort subjects’ natural behaviour
- prepare objective measures (recording sheets, checklists) to reduce the effect of observer bias, record data in a consistent format, and remind observers of what they are watching for. A personal judgement of whether a teacher treats male and female students equally relies largely on the quality of an observer’s opinion, and interpretation of what “equal treatment” means. More reliable would be a count of how often the teacher responds to hands raised by males and females, and a measurement of the average amount of time spent helping male and females.
- record field notes: open-ended recordings of observations that were not anticipated when the research began. They add details, and do not answer pre-planned questions or topics.
- if observation is overt, gain the trust, consent and confidence of your subjects by explaining the purpose of the observation.
- if appropriate, reassure subjects that they will not be judged or punished. Offer to share the research results with them.
- remain professionally detached. While developing rapport with subjects is desirable, becoming emotionally attached to them can distort an observer’s objective judgement.
- keep ongoing records, notes and recordings. Relying on your memory is unreliable.
- record exact quotes, not your interpretation of what was said.
- describe events without interpretation or evaluation. That can happen later.
- separate your own thoughts, opinions, expectations, experiences and assumptions from what you actually observe.
Disadvantages of observation
- It is susceptible to observer bias when personal judgements are called for, e.g. “Did male workers interact badly with female customers?” Male and female observers could interpret “badly” differently.
- People tend to perform better when they know they are being monitored.
- Observation consumes considerable time, money and labour.
- It may indicate what subjects do, but not why.
Surveys and questionnaires
A survey usually gathers primary data and opinions on a variety of broad issues. It is often used when research begins and little is known about the subject.
A questionnaire is often more focused than a survey, and gathers data that is more detailed and specific.
Advantages
- a lot of data can be gathered quickly and cheaply.
- responses can be easily compiled, processed and analysed using spreadsheets, databases or custom software.
- since everyone is asked exactly the same questions, responses can easily be counted, averaged and compared.
- without the personal presence of a questioner, observer bias is removed.
- they can be widely and cheaply distributed in great quantities (especially if online).
Disadvantages
- responses usually lack explanation or detail about context
- statistical results describe average trends, but say little about individual motives or feelings
- follow-up questioning may be impossible
- subjects are more likely to lie or fail to answer sensitive or embarrassing questions
- respondents may interpret questions differently, e.g. “Do you visit shopping centres frequently, sometimes, or rarely?” To one person, “frequently” may mean daily; to another, it may mean weekly.
- questionnaires cannot answer respondents’ queries
- respondents may not bother completing lengthy written responses. It may be hard or impossible to force compliance.
- if response is purely voluntary, the only respondents who submit answers may be those with strong opinions on the research topic, thereby introducing a self-selection bias into the data.
Writing questionnaires and surveys
- clearly decide what data you need to gather. Focus on a clearly-defined topic.
- write concise, specific questions. Vague questions will yield vague, ambiguous answers
- remove leading and loaded questions. You are a researcher seeking the truth, not an activist seeking to create the truth.
- decide which questions should be closed and which should be open. Closed questions are appropriate for basic information and are easy for subjects to answer. Open questions probe issues more deeply, but require more effort from respondents so they should not be over-used. If subjects see page after page of blank lines for written answers they may lose patience and stop responding. Reserve open-ended questions for the really important questions that are worth the extra effort required of respondents and analysts.
- try out the questions with test subjects and get feedback:
- do questions make clear and logical sense?
- is the language readable?
- are respondents giving the data you need?
- why are respondents skipping questions – confusion, privacy concerns, boredom, annoyance?
- include important information such as:
- the purpose of the research
- assurances of confidentiality
- thanks at the end
- protect respondents’ privacy: do not make them nervous by asking for unnecessary personal information (name, address, age, income). Only ask about sensitive information (e.g. race, religion, politics or sexual issues) if it’s crucial.
![]() Ages and incomes can be politely investigated by asking for ranges, e.g. “Are you aged: 13-17, 18-21,22-29” etc.
Ages and incomes can be politely investigated by asking for ranges, e.g. “Are you aged: 13-17, 18-21,22-29” etc.
Choosing samples
You will rarely be able to survey 100% of the target population, so you must choose a sample. Make sure samples are representative and not biased or atypical or you will collect biased data from which you will generate inaccurate information.
- American electioneers in the 1920s used a telephone survey to find who people would vote for. The poll predicted a huge victory for the conservative candidate. The election result, however, was a massive victory for the other candidate. Using the telephone system to conduct the poll introduced a large bias because in those days only wealthy families could afford telephones, so the only people polled were wealthy and more likely to vote conservative.
- A company conducted a door-to-door survey asking whether government pensions were adequate. An unexpectedly high number of responses said “no”. Why? The survey was conducted during week-day working hours, and there was a disproportionate number of unemployed, aged and infirm people at home at that time to answer the door and respond to the poll.
- Self-selection bias. A pollster in a supermarket found that an unusually-high number of shoppers did charity work. Why? Because the sort of person who does charity work is also the sort of kind, empathetic and helpful person who would stop and help out a poor, hard-working pollster in a supermarket. Simply choosing to participate in the survey self-selected a certain type of respondent, which can lead to bias in the results.
Distributing questions
Rarely can you force people to answer research questions, so finding a representative sample for a survey or questionnaire is not easy.
- approach people in public places, being careful not to unconsciously select or avoid people of certain sexes, ages, races, or appearance
- use an online survey with Google Drive or similar software, but be aware that any online poll will automatically bias the sample towards younger, wealthier, more technologically-capable respondents.
- poll your peers – but this of course also introduces an automatic bias towards young people living in a certain socio-economic class, possibly with restricted religious, cultural, gender, or ethnic variety
- leave copies of the surveys in shops – but self-selection will result in a high number of responses from people with a strong attitude for or against the topic you are researching. People with no strong feelings won’t bother filling in a voluntary survey
![]() How could you get a truly representative sample for a questionnaire to research young mothers’ attitudes towards immunising their babies?
How could you get a truly representative sample for a questionnaire to research young mothers’ attitudes towards immunising their babies?